Every week Dave Studeman writes a “Ten Things I Didn’t Know Last Week” column which always inspires further analysis. A couple weeks ago one of his items was about the White Sox distribution of runs scored. He found the White Sox were making the most of the runs they were scoring. To concisely summarize, when a team scores runs 2-7, those runs do the most to increase your chances of winning. The White Sox have been good at scoring 2, 4, 5, and 6 runs a game, while being held to 1 run or less infrequently. Dave posted a follow up article about run distribution, which has more detail and more research. This all made me curious about how the Tigers were scoring their runs.
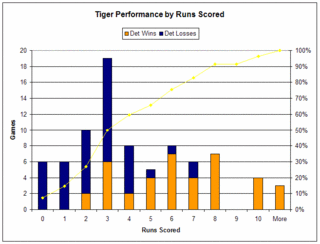
Below are charts that show 1. How often the Tigers scored each number of runs in a game (the total height of each bar) 2. Their record when scoring at a certain level (the mix of orange=wins and blue=losses), and 3. The cumulative percentage which is plotted on the right hand axis (ie The Tigers score 2 runs or less about 28% of the time.) I’ve done a chart just for the Tigers, as well as all of baseball so far this season.
Now of course the distribution for the majors is smoother than for the Tigers, just because there are more games. While the Tigers are about league average being at being held to less than two runs, they have a huge spike at 3 runs. As a result while the league scores 3 runs or less 41% of the time, the Tigers are held to that mark 50% of the time.
Now what about runs allowed? Below is the same graph, only by runs allowed.
You can see that the Tigers are much more likely to allow 4 runs, which tyically isn’t a bad thing. This year when opponents score 4 runs, the winning percentage is .527. Unfortunately, the Tigers have won only 7 of the 17 games in which they allowed 4 runs. Looking back at the runs scored chart and that spike at 3 may help explain this.
As far as win expectancy goes, Dave showed what the winning percentage was from 2000-2004 based on runs scored. Using Dave’s numbers and multiplying by the Tigers actual distrubtion, the Tigers expected wins would be 38.2. Being that run scoring is down slightly this year, I also peformed the same analysis based just on this year’s data. The result for the Tigers was 39.1 wins. Keeping in mind that this data doesn’t include Thursday’s game, both measures nailed the Tigers actual record of 39-43.
Conversely, based on the runs allowed distribution the Tigers expected record would be 43-39. Now the fact that the Tigers actual record matched what their runs scored would predict, and not what their runs allowed would predict is interesting – if not confusing. I’m not really sure what to draw from that and if anybody had ideas, please share. And just to throw one more measure out there, going into last night’s game the Tigers pythagorean record was 41-41.
UPDATE 11-12-05: Versions of these graphs for the whole 2005 season can be found here

What were the total number of games where we allowed 8+ runs? If that’s 5% below league average, that would explain why the pitching expectation isn’t matched. I can easily believe that our pitching has kept us from getting blown out at the league average rate while our offense has had blowouts at the league average rate.
You may be onto something. The Tigers allowed 8+ in 8.5% of games against a league rate of 11.5%.
As for the offense, they’re getting 8+ at the same rate that the defense/pitching is allowing them – 8.5%
Hmmm, That doesn’t explain how the offensive numbers accurately predicted 39 wins. If the pythag is 41-41 that means our runs scored and allowed are very close, if not equal, right?
So if we’re below league average on our number of blowouts produced, that would mean our distribution of runs is tighter than average which these theories say is a good thing.
By that logic, shouldn’t we have overachieved the offensive prediction by the same margin that we underachieved the defensive prediction?
Maybe the 7 run games hold the answer to that?
Maybe I’m just thinking too much….
Great stats though. I’ve never looked at it from this perspective. It really reveals the only hole in the pythag theory (it’s easy underachieve by increasing the run distribution)
Actually, it’s probably the 3- games that hold the answer, isn’t it?