Next in my series of recapturing the glory/trauma of the 2005 season I take a look at Win Shares. Other posts so far in the series include DL Time, Runs Created by Position, and Offensive Efficiency.
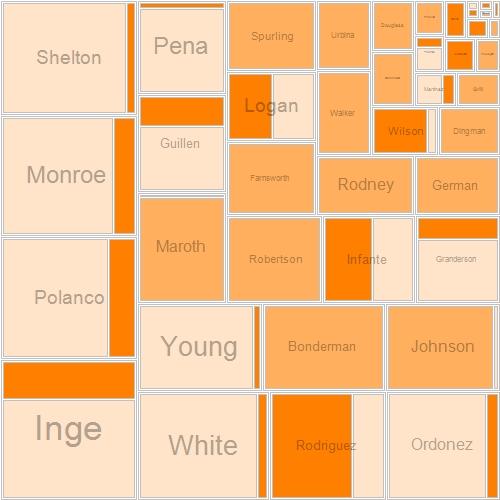
The image you see below is a treemap. Offense is represented by the light orange boxes, pitching is by the middle tone of orange, and defense is the darkest shade. (For more on treemaps and some earlier examples click here or here)
Inge led the team in Win Shares with 16.7. He also had by far the most playing time so the feat isn’t that astounding. Chris Shelton led the way with offensive win shares with 12.8.
Jeremy Bonderman led the staff in pitching win shares with 9.5 while Jason Johnson and Mike Maroth each contributed 8.5 It’s worth noting that during his time with the Tigers Kyle Farnsworth accumulated 5.9 win shares.
Pudge’s biggest contribution came via defense where he led the team with 8 win shares (although from what I’ve seen defensive win shares favor catchers).
As a team, 50% of the Tigers win shares came from the offense, while a third came from pitching and the remainder were defensive.
If you’re interested in perusing more win shares data, or for an explanation of win shares, check out the Hardball Times. And if you’re really interested in learning about win shares, it is probably best to go right to the source and get the Bill James book – Win Shares which describes the measure and methodology. (FYI – That’s an Amazon affiliate link which puts a few coins in my pocket if you choose to purchase the book)

SCORE! I frigging love the tree map. It makes sense to my simple art student mind. And its varied orange hues soothes the eye. And it proves what I always suspected: Kyle Farnsworth is the shit and nobody in the wide world would want Rondell for his arm.
It’s a bit surprising to me that Infante and especially Nook contributed about as much defensively as they did offensively, but hey, cool.