As the Tigers announced that Kenny Rogers was headed to the disabled list, I was finishing up some analysis on Rogers. Diving into the enhanced gameday goldmine, I looked to compare and contrast two of Rogers’s starts. His first game back against Atlanta when he was sterling and his last outing against the White Sox when he was hammered. Now we know that elbow inflammation was the cause of the problem, but how was the inflammation effecting Rogers?
The first thing I thought I would look at where Rogers was throwing the ball. Here we have pitch location from the June 22nd Atlanta start.
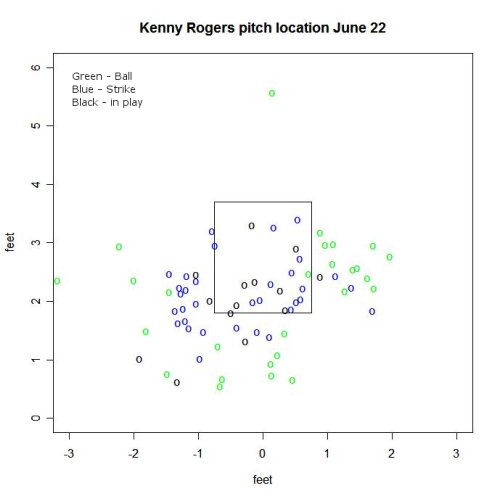
Notice that everything is at the bottom half of the zone if it’s over the plate at all. He kept quite a few pitches on the edges, especially coming inside to right handed batters.
Now look at the Chicago start on July 25th.
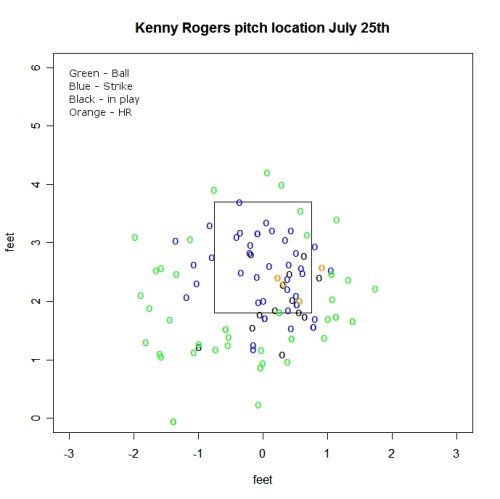
There are quite a few more pitches up, both in the zone and above it. Also, he tended to stay on first base side of the plate – which would typically be away from the right handed heavy lineup he’d face. But he was still in the strike zone with the bulk of those pitches. Rogers strength, as evidenced in the Braves was game i s getting strikes on balls outside of the zone.
Let’s move on to pitch movement and pitch selection. Movement as captured in enhanced gameday is explained pretty succinctly at the Hardball Times. Again, the top chart shows Rogers pitch movement by speed. The cluster of red pitches at the top is his regular fastball, which has little sink and is of course faster than his other pitches. The cluster of blue pitches at the bottom is a breaking pitch. Finally there is a cluster of pitches thrown in the low 80’s that have more sink than the fastball and a little more horizontal movement. I’m guessing these are a mix of change ups and 2 seam fastballs.
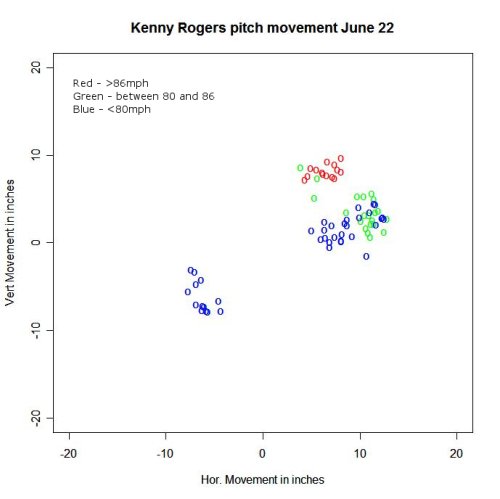
Now the same graph for the Chicago start.
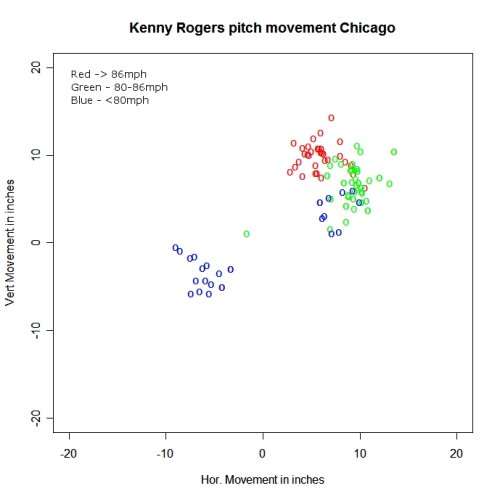
So that plot is hard to draw conclusions from, except that Rogers seemed to be throwing the ball harder more consistently. But also, there doesn’t seem to be the same delineation between pitches (except for the breaking ball). But taking the pitch speed out of the equation, we can just plot the 2 starts against each other (I tried to include velocity as well and differentiate shapes and it just got messy).
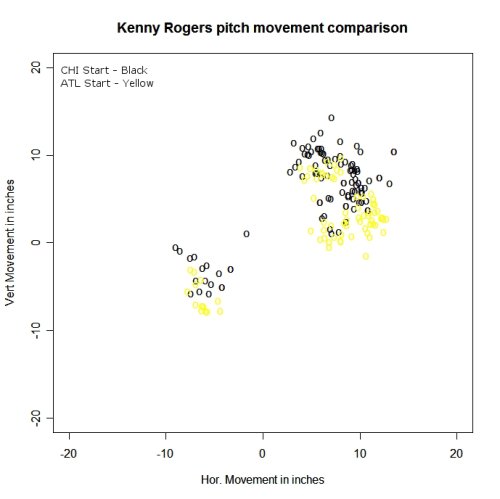
It becomes pretty clear on this graph that Rogers just wasn’t getting the same downward movement in his last time out. And this is probably the driving force of his struggles. Not only does it result in balls up in the zone, it results in balls up in the zone that have less movement and are thus easier to hit. Without overpowering velocity this spells disaster.
As for velocity, that wasn’t an issue at all – or at least a lack of it wasn’t an issue. Rogers was throwing the ball harder in Chicago.
MPH	ATL	CHI
<72	6	1
72-74	6	7
74-76	8	7
76-78	10	3
78-80	10	7
80-82	15	11
82-84	4	22
84-86	6	5
86-88	7	13
88-90	2	13
>90	0	5
In the past Kenny has said he’s better in the mid to high 80’s because otherwise his ball flattens out. I wonder if the extra velocity caused the lack of drop in his pitches, or if he ramped up the speed to compensate for a lack of location. Chicken, egg, who knows.
In any case, Kenny Rogers finds himself on the DL with elbow inflammation. Whether it is because he tried to come back to soon, or if it is simply a matter of a 42 year old pitcher breaking down the Tigers are now in a bind. Jordan Tata will get the next start, and after that I’m not sure. It could be some combination of Tata/Vasquez/Bazardo or Chad Durbin may be back in the rotation.


