The Tigers walked a lot of people last year. Along the way they threw a lot of pitches, and many seemed to be ill advised. The performance cost Chuck Hernandez his job, jettisoned in favor of an instructor whose students have gone on to gain some renown as strike throwing machines. Armed with a season’s worth of pitch f/x data I’m ready to start delving into this whole strike throwing thing. We’ll start today with some general league wide information.
For those unfamiliar with pitch f/x I’ll have some additional links to more information at the end of this article. The short explanation is a couple of cameras measure the direction and speed a ball is moving shortly in front of the mound. From this the pitch’s path is calculated to within an inch of where it crosses the front of home plate. And it draws the trajectory in the MLB.com Gameday application. On to the data…
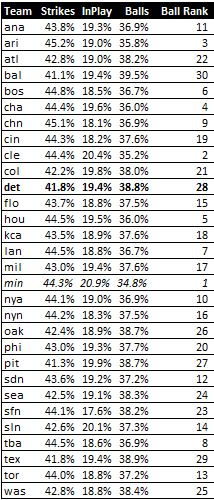
Starting at the most simple level, let’s look at the respective rates at which teams threw balls and strikes. The table below shows the breakdown for all 30 teams. (These data are from pitch f/x, which doesn’t capture every single pitch, but should be sufficient).

No surprise that the Tigers rank near the worst in the league in terms or throwing balls. But what is surprising is the difference between the Tigers and the best. The best as you may notice are the Twins, but that gap is 4%. When you have 125 pitches that is a difference of 5 pitches a game being balls instead of strikes or in play. Now it only takes 4 pitches to walk a batter, but those pitches are most likely not all going to one batter. And the difference between the Tigers and the Twins in terms of walks was 238 this year. Put otherwise, the Tigers walked 58% more hitters than the Twins.
You may have also noticed from the table that the Twins lead in another category besides fewest balls thrown. They were first by a substantial margin in terms of their pitches being put in play. It speaks to the organizational philosophy about early strikes and getting the opponent to put the ball in play. For this we’ll move onto the next table which simply looks at how often the ball is thrown in the strike zone.

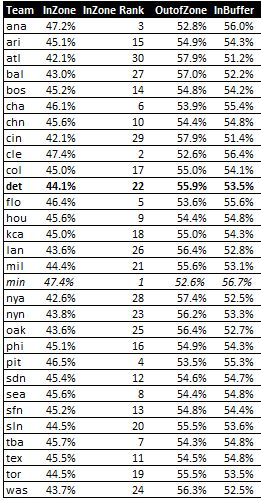
InZone is simply whether or not the ball crossed the front home plate in within the strike zone. The strike zone is of course 3 dimensional so the ball could clip the zone later, but this is what we have to work with. The Tigers are in the bottom third when it comes to putting the ball over the plate. The Twins are first which explains the lack of walks and the high number of balls put in play.
One other column I added was a buffer zone. I added 1.5 inches to each of the 4 sides of the strike zone. I wanted to see how how often pitches were either in the zone or “close” to the zone. The types of pitches that might entice someone to swing because it’s too close to take. The Twins have a lead here too, but the rankings don’t really change to much across the board so it doesn’t seem that teams vary too much in their ability to throw pitches near the strike zone.
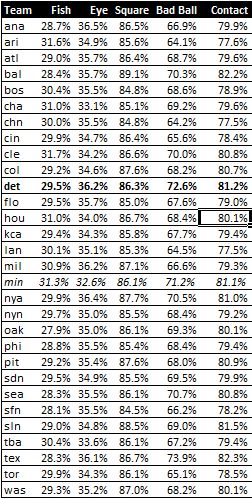
The last table we’ll turn to is the product of some work Dan Fox did with pitch f/x data and is called Fish-Eye. Fox did this to look at batter plate discipline, but I turned it around to see if certain staffs could render hitters less disciplined. The column headings are defined as:
* Square: This is the new metric, defined as the percentage of pitches in the strike zone swung at and made contact with. A high value here (relative to the average of over 86.3 percent) indicates that when the batter offers at a strike he usually makes contact. On the contrary, a lower value indicates hitters who, for reasons such as a long swing, are more apt to swing through strikes.
* Fish: Defined as the percentage of pitches out of the strike zone that the hitter swung at. A higher percentage here indicates that the hitter may have trouble recognizing pitches since he is offering at pitches that would likely be called balls. Average values here are between 29 and 30 percent.
* Bad Ball: Defined as the percentage of pitches out of the strike zone that were swung at where contact was made. This includes foul balls, although there is an argument to be made that a foul ball is not the intended outcome, and so should be discounted in some way. A higher value in this category indicates that, when swinging at bad pitches, the hitter is at least able to get the bat on the ball. Average values lie around 68 percent.
* Eye: Defined as the percentage of pitches in the strike zone on non-three and zero counts that were taken for strikes. A smaller value in this metric indicates a player who recognizes strikes and aggressively offers at them.I excluded 3-0 counts, since a hitter is much more likely to let a strike go by in this situation, and we don’t want to penalize them for that behavior.(I didn’t exclude these counts). Average values here are in the range of 35 percent.
I’ve also added Contact which is the percentage of time a hitter swings and makes some sort of contact.

Earlier we saw that the Twins got a high number of balls in play on their pitches but weren’t hurt too much because of it. Part of the reason is that there weren’t free passes putting guys on. But perhaps another reason is that they have a lot of hitters chasing pitches that are off the plate and not perhaps not making solid contact. It’s a recipe for success. The Twins throw more pitches in the strike zone than anyone, and they get hitters to chase more pitches off the plate than all but one other team.
But oh yeah, this is a Tigers blog. Forgive me if I look longingly at the Twins and with great hope given that the Tigers new pitching coach was heavily involved in development of the guys who did the work – Rick Knapp. As for the Tigers on these measures, they were pretty vanilla and close to the means. The exception was in Bad Ball where hitters made consistent contact with balls out of the strike zone. I don’t know if this is good or bad – yet.
Next steps are to look at the Tigers as individuals, and to look at location and results by count.
nice stuff billfer. looking forward to the rest.
This is great. I just gave it a cursory read-through, and I’m going to take a look again tomorrow.
The Twins staff is a staff full of guys who can throw strikes but who don’t really have out pitches. The Tigers have a few guys who have true out pitches (all three of Verlander’s, Bonderman’s slider, Galarraga’s slider, Miner’s change, Zumaya’s fastball, Rodney’s change). Imagine what they could do if they pounded the zone. If the Twins pitchers can get hitters to chase their not-great stuff off the plate because they are always ahead 0-2 or 1-2, then imagine what Verlander could do if he got 0-2 on people and was able to throw closer to the zone than he did this year.
If you look throughout recent history, you’ll find that the best pitchers, and even the best power pitchers, were always strike throwers who could put people away. Clemens, Schilling, Pedro, Smoltz, Mussina, Johan, Doc, and the granddaddy of all strike throwing put away pitchers, Randy Johnson from about age 28 on.
To record a strike you either need to
A) Have the batter swing and miss
B) Hit the strike zone (as determined by the day’s home plate umpire)
C) Have the batter hit a foul ball that is not caught (out of a fielders reach)
Therefore if you have certain pitches with tons of movement and control of those and you know the weaknesses and strengths of a hitter you don’t have to hit the strike zone.
A fast fastball is a bonus.
Umpires usually give the pitchers you named Eric the benefit of the doubt, whereas a guy like Nate Robertson might not get the same location called.
Where was the Home Plate UMPIRE on Kazmir last night?
They royally screwed him, he had quite a few beautys – at the knees that were shown after to be strikeouts.
Ended up booting him from the game when he could have kept going, it’s too bad.
And the point is it happens to guys on our staff just like it did to Kaz.
I wonder if he would have gotten those calls at the Trop with the aide of the cowbell wavers
Me thinks so…
BTW
I understand what you’re saying Bill
I’m wondering if their guys like Baker, Liriano, Blackburn, Slowey and Perkins have more off speed pitches either changeups curveballs and the rest to get guys to “fish”
ONE POINT
Plus it has been an organizational philosophy to go after guys who throw hard, and bring them up right away (Verlander/Bonderman/Miller and possibly Porcello) etc.
The Twins I believe don’t go after so many hard throwers Santana was luck and dominated on his change up and they had Radke and our good ol’ Kenny both of whom weren’t gassers and naturally by necessity relied more on control
ANother point
Plus another thing to muckity muck with all this data are guys like Willis and Rodney. Two muck ups who for the life of them had quite a bit of trouble finding the catcher even. That might skew last year’s data a bit towards the Twins.
And another POINT
While I’m not against guys who hit the zone, two of our best guys who do that (Rogers and Jones) didn’t fare too well this year.
I wonder if 2006 shows this much difference – which in quite a few spots isn’t that much.
We don’t need throwers, we don’t need injuries we need pitchers, hopefully Knapp has a knack combined with knowledge to knowhow to get guys to pitch and do it well. If so knock on wood and say yay!
Some 2008 2-2 count things…
BABIP on 2-2 count
Rogers .246
Bonderman .250
Galarraga .268
TEAM .301
Verlander .367
Robertson .383
K/PA on 2-2 count
Galarraga 48.6%
TEAM 41.5%
Verlander 40.3%
Bonderman 35.5%
Robertson 33.3%
Rogers 31.5%
BABIP after 2-2 count
Galarraga .247
Rogers .259
TEAM .308
Robertson .316
Verlander .357
Bonderman .379 ?
K per BB after 2-2 count
Galarraga 4.7
Verlander 2.9
TEAM 2.1
Robertson 1.9
Bonderman 1.5
Rogers 1.4
I guess my main question would be: What is Verlander throwing on a 2-2 count? Galarraga?
David – the Zone consistently favored the Phils to such an incredible degree, it certainly has to make you wonder if Tim Donaghy had some friends in MLB working the game Monday night. Smallest strike zone I’ve seen this year for Kazmir, while Hamels was treated to a very large strike zone.
The Umpires can EASILY tilt the scales either way on an over/under, so you’d think MLB would try to eliminate different strike zones for different pitchers/players from one night to the next. They can turn a shutout into a shelling just like that, and vice versa.
Smoking Loon: “I guess my main question would be: What is Verlander throwing on a 2-2 count? Galarraga?”
I want to know what Rogers is throwing on pre 2-2 count pitches, because if his BABIP on 2-2 is .246, and BABIP after 2-2 is .259…well let’s just say his BABIP for the rest of the counts must be a wee bit higher….
Coleman, I think the key for Rogers was to never, ever get 2 balls behind in the count. Or maybe behind in the count, period. Obviously, he did so rather often.
In other news, for both Rogers and Verlander (and no one else was beyond dead-even), a HR was twice as likely/unlikely after a ball/strike on the first pitch. This jibes exactly with JV’s career numbers, and to a somewhat lesser degree with Kenny’s.
‘What is Verlander throwing on a 2-2 count? Galarraga?”
On second thought, Armando as a pitched ball anywhere near the plate would be easy to hit, but I’d predict a much lower BABIP for JV and a much shorter career for AG in that case.
I think Verlander may wrench his back trying to throw Galarraga, so I’d advise against it.
Ha. I was actually more worried about Galarraga’s health.