Curtis Granderson’s 2009 season has received plenty of scrutiny, and this was even before trade rumors crept up. Granderson struggled at times during the season, and had a hard time sustaining success. His .249 batting average was the lowest of his career and it was a drag on his on base percentage and slugging percentage as well. We know batting average is volatile so did Granderson just suffer from some bad luck, or did something else change? Fortunately we have hit location data to help shed some light on these questions.
Granderson’s batting average was dragged down by a .276 batting average on balls in play. That is a number that should typically be in the .320ish range, especially for someone with Granderson’s speed. A shift like that would lead people to think he was largely unlucky. A closer look would show a shift in his balls in play from the harder to field grounders to the easier to field fly balls. Ask fans what they saw and many would say it looked like Granderson got overly concerned with the homers (a new career high) and that he pulled the ball to much. But what would the data say?
Spray Charts and other data
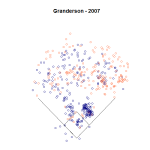
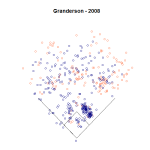
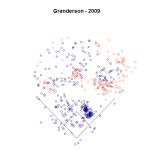
Below are spray charts for each of Granderson’s last 3 years. These charts were assembled by using data from the MLB.com Gameday application. The hit locations are reported by the MLB.com stringer and aren’t absolute positions in the sense that Pitch f/x measures things, but this serves as a very nice proxy. The blue dots are outs, the orange dots are hits. Click on each chart to get a larger view.
One of the nice things about spray charts is that there is plenty of data and certain trends can emerge. One of the not so nice things about spray charts is that there is plenty of data and they can sometimes be overwhelming.
The pretty orange table to the right takes the above spray charts and puts them into tabular form. The vector is the direction the ball was hit. Second base is 90 degrees from home plate, the first baseline is at 135 degrees and the third baseline is at 45 degrees. The gradient shading indicates the higher percentages, the darker the field, the higher the concentration of balls in play.
While he’s been a pull hitter his whole career, it became much more pronounced in 2009 with half of his balls in play (50%)between the first baseline and the approximate spot of the second baseman. That easily topped his previous seasons where he had 42% and 46% in 2007 and 2008 respectively.
Summarizing the table into a more compact table gives us:
Dir.	2007	2008	2009
Oppo	16.53%	21.41%	16.53%
Middle	36.23%	34.22%	29.08%
Pull	46.40%	42.60%	50.60%
Opposite is defined as vectors 50-75, middle is defined as 80-105, and pull is defined as 110-135 (keep in mind these are actually buckets so the something like 76 would fall in the 80 bucket and 46 would fall in the 50 bucket).
Granderson went the opposite way at the exact same rate as 2007, his best season. The 2008 season was when he spread the ball around the most, but the difference between 2009 and the other season was the rate at which he took the ball up the middle.
Pulling the ball isn’t a bad thing
We hear it all the time that batters get too pull happy. Maybe Granderson falls into that category in 2009, but if you look at his overall numbers he hits MUCH better to the pull field. For his career he hits .470 on balls that he pulls versus .302 on balls up the middle and .293 on balls to the left side.
Granderson continued to thrive when pulling the ball in 2009, perhaps dismissing the notion that he was pull-happy. He posted a .457 batting average on pulled balls as opposed to hitting .241 up the middle and .221 to the opposite field.
But I won’t dismiss the notion and instead speculate that Granderson either a)tried to pull the ball too much and balls the other way were accidents or b)had a mechanical change that prevented him from driving the ball when he wasn’t pulling it. Or maybe it was some combination of both, like b) fostering a).
The air outs
The biggest change in Granderson’s batted ball distribution was the exchange of ground balls for fly balls. Granderson’s line drive rate was right in line with his career mark (21.2 % in 2009 and 20.7% overall). But Granderson for his career is a 36% ground ball hitter and a 43% fly ball hitter. In 2009 those numbers were 29% and 49%. This shift helped Granderson’s home run production, but it hurt his batting average on balls in play driving down his overall batting average.
Not all fly balls are created equal. Some fly balls have a chance to become home runs or gappers. Pop-ups have a very small chance of becoming anything other than an easy out. Unfortunately Granderson hit a ton of pop-ups in 2009. Those pop-ups also accounted for a healthy percentage of the balls that Granderson hit to the opposite field.
You’ll see that the Fly Out profile remained fairly consistent in terms of distribution across each of the last 3 years. It’s the fly balls classified as Pop Outs that rose dramatically. Also, Granderson did tend to pull everything that he hit on the ground with only 26 ground outs that weren’t pulled in 2009.
*A brief aside on classifications – These are how MLB.com classified items and they are the ones that made distinction between Pop Outs and Fly Outs. Also, these are pretty much the classifications we have to work with. I don’t have information like “Ground ball single to left” to account for hits that went to the left side on the ground.
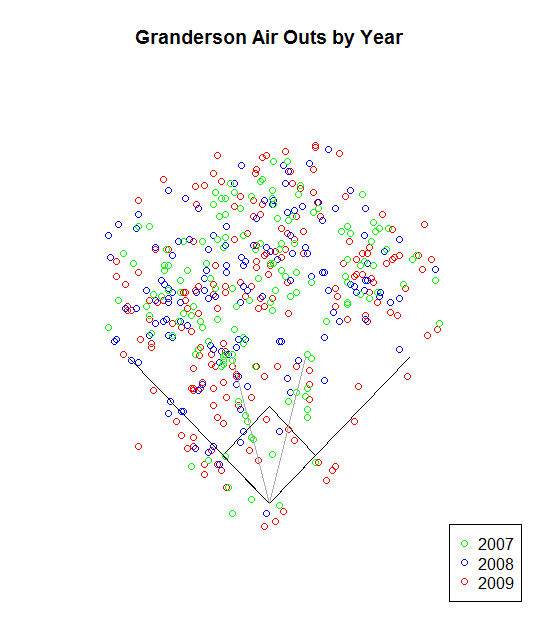
For those who prefer the visual representation of the spray chart, the plot below has all of Granderson’s Fly Outs and Pop-Outs for the last 3 years.
 Visually it’s easy to see the disproportionate number of red dots as opposed to the other colors. The other thing I think I see (haven’t quantified it) is that there are more deep blue and green dots in left field.
Putting it together
As with most things there isn’t just one answer. Because he still did well when pulling the ball, I don’t think he was necessarily pulling the ball too much. The pop-ups were a large source of the drop in batting average with infield flies having a similar negative impact as a strikeout. It almost always results in an out and almost always fails to advance runners. The difference is that a couple manage to drop (ask Gerald Laird and his love affair with the right field foul line).
Hitters do have some control over infield flies and with Granderson doubling his rate there was probably a change. The 2006 Hardball Times annual shows us that there is a .60 year to year correlation for infield fly rates for hitters so it is something that hitters do have control over.
Using the xBABIP calculator Granderson’s BABIP should have been about .301. So we can ballpark it and say half of his dip in BABIP can be attributed to bad luck, and about half can be chalked up to a change in batted ball distribution.
I don’t know that Granderson needs to use the whole field to be effective. He was very effective in 2007 without hitting a lot of balls to the opposite field. But he probably does need to use more of the field than he did in 2009 when a big chunk of opposite field balls were merely pop-ups.
References
The sites where data was drawn from were linked in the context of the article, but I also used The Hardball Times Baseball Annual 2006
for data on infield fly repeatability. The spray charts and corresponding data were produced by following the examples in the uber valuable Baseball Hacks
book.


Great work Bill. Loved this post.
Tremendous work Billfer. I had looked at the spray charts a while ago and noticed that he had virtually no extra base hits to the opposite field in 2009. It was good to see you quantify everything so thoroughly.
Lee
I would guess that I saw, via Gameday (no tv or in-person), most of Granderson’s ABs this past season. I seem to recall him having a lot of difficulty with pitches on the outside edge/outside. If he was trying to pull those pitches, could that account for the big increase in pop-ups to the left side – note the huge number of red squares in the infield and even foul territory on that side and the paucity of long outs to left.
Sounds about right to me, Vince.
Great work Billf. I’m surprised the skew toward right this year isn’t even more pronounced, but i suppose that’s just selective memory of all the pop outs and balls he rolled over on. I’m sure he’ll make it a priority to address this in the offseason/spring training.
Also, i suspect it’s damn hard for Grandy to pull lefties, and maybe he’d find more success against them if he altered his approach to taking them up the middle? Do these data sets come with left/right splits? It would be interesting to see if we could identify the cause for his success against lefties in 2008.
I have the data to do splits, but I pretty much reached my limit on this analysis. Maybe I’ll come back to it.
Great article by Bilfer indeed. A+
My opinion is that Granderson’s primary malfunction has more to do with his swing selection and process more than anything else. He swung at an inordinate number of bad pitches last year than I have ever seen him do before. This is actually my #1 gripe with the hitting coach’s program, in that they don’t use proper tactics to instruct the players in how they should approach different pitch count situations. If we can fix that and that alone, we could pick up an extra couple wins per year from that one adjustment.
I think a big reason that he had so many swings at bad pitches is because he took too many good ones, got behind in the count, and…well, did what you do when you’re behind in the count too much. And I think the reason he got in this conundrum was an effort to see more pitches, which I think he believes is part of his job as a leadoff hitter (he has said as much). Which is why I think he does better batting 5th.
Not that I really have anything solid to back this up (I have tried a couple of times…perhaps I’ll try again someday). But it seems both to fit what I have seen and also make sense.
FWIW – Granderson’s percentage of pitches that he swung at outside of the strike zone in 2009 was right in line with his career numbers. In fact, it was 2007 when he swung at the highest percentage of pitches outside the zone. The difference in 2009 was that he made contact with more of those outside the zone pitches than he had in past years.
TSE,
“This is actually my #1 gripe with the hitting coach’s program, in that they don’t use proper tactics to instruct the players in how they should approach different pitch count situations.”
Yeah, I remember combing through the program McClendon made public that outlined his coaching tactics. It was a very interesting read, and I was just as surprised as you must have been to learn that they weren’t using proper tactics.
Best piece you have ever done. Great stuff.
You lost me with luck being factor.
I have no problem with Granderson pulling the ball more. IMO, if he worked on pulling the ball even more, he could be a 40 home run guy. He’s bulked up enough to do it. I really do think it’s time for him to take his game to that next level.
BTW, there is a natural progression for most hitters, whether it be Barry Bonds, Luis Gonzalez, or Curtis Granderson.
Why wouldn’t luck be a factor? Random variation is a significant part of the year to year swings in performance for both pitchers and hitters.
In the case of Granderson, look at the 3 spray charts side by side, you don’t even need to blow them up. Look at the right centerfield gap in 2009. There is actually a divide there in 2009. Being that it is a gap, many of the dots in that area were orange in 2007-2008. Do you really think something fundamentally changed that prevented him from hitting that gap, despite the fact he still hit a large number of balls to right and center fields?
I just don’t agree with how the word luck is used so loosely by the sabermetric folks, especially for something that takes a heck of a lot of talent. It would be like me saying that you are lucky that your website is awesome. IMO, your success is due to your hard work, friendliness, great writing ability, and passion for the Tigers. Luck has nothing to do with it. This blogsite may have it’s ups and downs, but that’s how you make progress when you learn from each little mishap. Then there is the X factor, which is what the Tigers are doing, but that’s not luck either.
As for Granderson with the spray charts, I’d wonder how many players do have a consistent spray chart year in year out. It seems like Grandy is getting pigeonholed here.
For the luck aspect, I was referring to the folks at the xBABIP calculator link.
I wonder if the results would be much different for similar players like Ian Kinsler or Grady Sizemore?
Keith, “luck” means that a player’s BA (for example) can bounce up and down from year to year based on cheap hits dropping in or line drives being caught or facing tougher pitchers one year compared to the next. Even if a player has the exact same talent and performs in two different seasons, his batting average won’t stay the same based on factors outside his control.
Luck has lots to do with billfer’s web site. He has a lot of talent and most of his stuff is great but some months he might be better than others. Maybe there is not a lot to write about in a particular month so it’s harder for him come up with his best articles, so he doesn’t write as well in that month as he usually does. He might have the same talent and work just as hard all the time but sometimes he is better than other times.
When sabers use the word luck, they are not saying anything good or bad about the player. They are talking about things that were out of the player’s control.
They are talking about things that were out of the player’s control… and will generally balance out in the long run anyways.
They balance out in the long run but sometimes one year is not long enough for things to balance out. Over the course of a long career, it would be almost impossible for a player to be the victim of a disproportionate number of hard hit outs. Over one year, it could certainly happen There are only 15 hits in 500 at bats between a .250 hitter and .280 hitter.
This is actually a pretty good example. If you count hits as “success” there are elements I can control and elements I can’t. I can try to consistently produce quality content which is probably key. But things beyond my control also impact traffic. Maybe a write a thorough article that doesn’t get linked to and doesn’t drive traffic for whatever reason. Other lesser articles might get more links. And I have no control over when news breaks. I think this was my best article this month, but I got a lot more hits last week because Granderson and Jackson’s names got floated as trade rumors.
One area that was not discussed was his failure to effectively hit left hand pitching. He was under 200 against lefties.
That’s certainly an ongoing problem, but he only had about 50 more plate appearances than in 2007 and 2008, so that’s not a major cause in his batting average decline. It’s certainly a factor, though.
Even I found this fascinating. Staring at the colors and wondering why he was pulling the ball more in ’09. Fabulous job, billfer. Do you think Lloyd looks at charts like this? Or anyone else in the Tiger organization?
I’d at least hope they use this for defensive purposes. I have no idea what data they use and don’t use.
.230 .307 .388 .696 346 PA (.261 BABIP)
.267 .345 .516 .861 364 PA (.289 BABIP)
There is a big enough differences in these two guys, and over enough plate appearances, that it looks like a significant difference and that the 2nd player is clearly better than the 1st. These two guys are Granderson at Comerica and Granderson away last season.
Is it possible that Granderson just doesn’t have real HR power and benefitted from pulling a bunch of line drive HRs in small parks?
HRs 2009 Comerica/Road
Cabrera 19 / 15
Inge 14 / 13
Granderson 10 / 20
Raburn 9 / 7
Team: 92 / 91
(Raburn had 199 fewer Comerica PAs than Granderson by the way).