Dan Fox at Baseball Prospectus recently did a post where he used the enhanced gameday (aka pitch/fx) data to categorize hitters by eye. He broke hitters down into the following groups and subsequently created some pretty slick graphs.
- Square: This is the new metric, defined as the percentage of pitches in the strike zone swung at and made contact with. A high value here (relative to the average of over 87 percent) indicates that when the batter offers at a strike he usually makes contact. On the contrary, a lower value indicates hitters who, for reasons such as a long swing, are more apt to swing through strikes.
- Fish: Defined as the percentage of pitches out of the strike zone that the hitter swung at. A higher percentage here indicates that the hitter may have trouble recognizing pitches since he is offering at pitches that would likely be called balls. Average values here are between 32 and 33 percent.
- Bad Ball: Defined as the percentage of pitches out of the strike zone that were swung at where contact was made. This includes foul balls, although there is an argument to be made that a foul ball is not the intended outcome, and so should be discounted in some way. A higher value in this category indicates that, when swinging at bad pitches, the hitter is at least able to get the bat on the ball. Average values lie around 73 percent.
- Eye: Defined as the percentage of pitches in the strike zone on non-three and zero counts that were taken for strikes. A smaller value in this metric indicates a player who recognizes strikes and aggressively offers at them. I excluded 3-0 counts, since a hitter is much more likely to let a strike go by in this situation, and we don’t want to penalize them for that behavior. Average values here are in the range of 25 to 27 percent.
While Detroit Tigers hitters were included in the analysis, it was tough to tease out exactly where they fell. Inspired, I thought I do the same analysis but focus on the Tigers. My numbers didn’t work out exactly the same as Fox’s, but the categorization of the players seemed to be fairly consistent. One reason for the disparity on the Eye metric is that the way I parse the data, I didn’t have the count readily available so I didn’t filter out taking on 3-0. The other discrepancy is probably the width of strike zone used. Fox said he used the 17 inch wide plate. Because only a portion of the ball has to cross the plate for a strike, I included the radius of the ball on either side of the plate as well. I’m also not sure how he included bunts and bunt attempts or being hit by a pitch. Regardless, the points remain the same.
As for the specifics on how the numbers differed, here are the league averages I calculated for each:
- Square: 86%
- Fish: 29%
- Bad Ball: 70%
- Eye: 36%
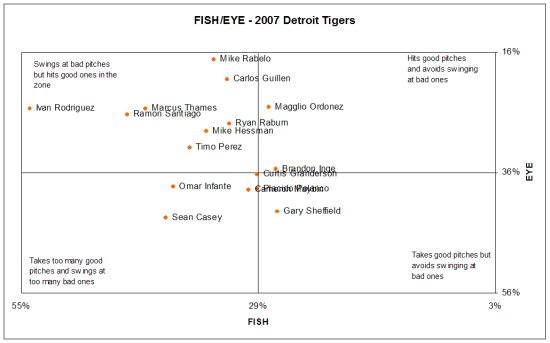
Fox then graphed Fish value against Eye values which put hitters into one of four categories. The graph of just the Tigers hitters is below:

The first things that jump out in these types of graphs are the outliers. I don’t think that anyone is surprised that Pudge Rodriguez swings at more pitches out of the zone than anyone on the team. In fact, he swings at more than anyone in Major League Baseball.
What may surprise though is Sean Casey being in the lower left quadrant. Casey doesn’t strike out a whole lot, but he tends to swing at the bad pitches and take the good ones. The other surprise, especially given his strikeout rates, is Brandon Inge who is better than many of his peers in swinging at the pitches he should swing at and taking the ones he shouldn’t. Of course check swings where you go to far are still counted as swings so make of that what you will.
The last thing to notice is pretty much a team wide trend, and that is that the team tends to lean towards to the left, and that they are more likely than a typical team to chase pitches out of the zone. Even those players in the more patient hemisphere still are towards the middle. On a team level it confirms what pretty much everyone suspected based on observations.
The table below has the numbers for each of the Tigers:
Player			SQUARE	FISH	BADBALL	EYE

Brandon Inge		84%	27%	54%	35%

Cameron Maybin		80%	30%	40%	39%

Carlos Guillen		86%	32%	73%	20%

Curtis Granderson	89%	29%	63%	36%

Gary Sheffield		87%	27%	79%	42%

Ivan Rodriguez		81%	54%	77%	25%

Magglio Ordonez		88%	28%	76%	25%

Marcus Thames		73%	41%	63%	25%

Mike Hessman		82%	35%	65%	29%

Mike Rabelo		83%	34%	74%	17%

Omar Infante		84%	38%	79%	38%

Placido Polanco		96%	29%	89%	39%

Ramon Santiago		86%	43%	73%	26%

Ryan Raburn		77%	32%	60%	28%

Sean Casey		95%	39%	84%	43%

Timo Perez		88%	37%	84%	32%

Team			86%	33%	72%	32%
Baseball Prospectus | Articles | Schrodinger’s Bat: The Return of the Fish Eye


