Category Archives: Statistics

Playing in the spray

I love looking at spray charts of batted balls and seeing where hitters have success. I’m funny like that. Fortunately Dan Fox, proprietor of his own blog and writer for Baseball Prospectus has released an application that shows ball in play distributions for the last 4 years and he just released the updated version including 2007 data. With the heavy lifting done for me, I thought I’d take a look at 3 of the Tigers more interesting hitters from the last year.

Brandon Inge

First up is the ever controversial Brandon Inge. Inge had an awful season at the plate as he posted a meager 236/312/376 line. Part of his problem was what seemed to be an endless supply of check swing strikeouts. And that appears to be the largest difference over the past few years. Inge’s batting average on balls in play was .334 which wasn’t out of line with his past performances. His batted ball distribution didn’t differ greatly from his fairly productive 2006 season.

BABIP GB FB LD PopUp
2003 R 0.262 44.8% 31.3% 17.9% 6%
2004 R 0.344 42.6% 30.3% 19.4% 7.6%
2005 R 0.333 39.5% 34.3% 18.7% 7.6%
2006 R 0.324 39.9% 34.1% 15.1% 10.9%
2007 R 0.334 37.9% 31.8% 20.6% 9.7%

Inge actually upped his line drive rate and had a small improvement in his pop up rate, yet his overall performance dipped.  Maybe he was a little unlucky like he claimed earlier in the season?

Another complaint about Inge is that he became too pull happy.

Left Center Right
2005 41.0 28.3 30.6
2006 48.1 27.0 24.8
2007 48.1 22.0 29.8

Inge did become more of a pull hitter in 2006 and it worked to his benefit as he slugged .463 and 27 balls left the park.  He pulled just as much in 2007 but with a lot less success and a lot less power.  We also saw Inge go to the opposite field more often, but it was at the expense of going up the middle.  Based on observation and the data, it seems like it was more a function of Inge being late than looking to punch the ball to right.

Curtis Granderson

Nobody complained about Granderson pulling the ball too much, and he actually was more likely to pull the ball than Brandon Inge was. Of course, when you’re among the league leaders in extra base hits it doesn’t really matter where you hit the ball.

GB FB PU LD %
Left 25 45 26 16 25.2%
Center 25 57 4 19 23.6%
Right 116 40 10 62 51.2%

With Granderson’s proclivity for pulling the ball on the ground, it wouldn’t surprise me to see more teams shifting the shortstop closer to second base. I wouldn’t expect an Ortiz type shift because of Granderson’s speed and ability to bunt, but Curtis did hit .600 on grounders through the middle in 2007.

Magglio Ordonez

It seems that any look at Tigers performances isn’t complete without at least glancing at how Ordonez fared. It was a popular refrain from Rod Allen that Maggs was using the whole field, and it really was true. Ordonez hit 42% of his line drives to right field. And overall he hit the ball to right field as much as he hit it to left.

GB FB PU LD %
Left 126 14 8 34 37%
Center 32 51 4 30 24%
Right 62 65 18 46 39%

That kind of balance made it impossible for any team to load up one side. And in a spacious outfield like Comerica Park that gave Ordonez a lot of room to work with. Now granted he was still lucky in 2007. You don’t exceed career norms by that much without some things going your way. In the case of Ordonez it was a .318 batting average on ground balls and a .361 batting average on fly balls. MLB norms for the last 4 years were .233 and .272 respectively.

There’s a ton of information available, and it’s all free. So thanks to Dan Fox for his hard work, and let me know if you see anything interesting.
The 9th Inning

All season, reader Sam Hoff has been calculating the team’s performance over 18 game stretches. Why 18? Because it represents 1/9th, or one inning of the season. Here is his 9th inning report. Thanks to Sam for his contributions all season

The 9th Inning is over.

Each 18 games represent 1 inning of a baseball season. The Tigers record for each inning in 2007:

                                                     Starters:         Bullpen:
    W-L   RS-RA   HR-SB-AVG/OBA/SLG    W-L-IP-   ERA       W-L-S-ERA
1: 10-8   86 -79  17-9 -235/313/380    5-2-110.2-3.66      5-6-8-4.68 
2: 13-5   112-97  23-10-308/377/518    9-3-102.1-4.84      4-2-8-5.03
3: 7-11   110-96  26-7 -310/364/517    7-7-110.2-3.99      0-4-3-7.80
4: 13-5   136-75  20-5 -324/390/508   13-4-103.0-4.37      0-1-2-3.47
5: 11-7   91 -79  23-20-272/357/443   10-5-112.0-3.46      1-2-7-3.33 
6: 7-11   84 -113 17-8 -276/325/415    3-8- 99.2-6.59      4-3-6-4.31
7: 7-11   83 -110 20-10-266/315/436   4-10-101.0-6.50      3-1-4-5.12
8: 10-8   95 -77  15-18-298/373/455    4-5- 91.1-4.93      6-3-1-3.18
9: 10-8   90 -71  16-16-292/349/445    7-6-101.1-4.17      3-2-5-3.15

In my 8th inning recap I said that the Tigers needed a 14 win 9th inning to have a shot. In retrospect, that wouldn’t have been good enough. They would of needed 16 wins to tie the Yankees, or subjectively 15 wins including a sweep of the Indians to tie them. The 9th inning started 5-1 before getting swept at Cleveland which effectively ended the hope for post season. They played 5-4 after being swept.

In looking at the season above, it is the three 7-11 innings that did the Tigers in. It is no coincidence that those 3 innings are also the only inning in which either the bullpen or the starters had an era over 5.03. No matter what the Tiger offense does (and they outscored the 2006 version by 65 runs), it all comes down to pitching as the Tigers 2007 ERA jumped by 0.74 (3.84 to 4.58). Those numbers are even more exaggerated when you consider that the American League saw less scoring in 2007.

I’d like to say the Tigers should rebound, but they have the oldest batters in AL (average age 30.9, older than the Yankees 30.6). They also have the 5th oldest pitching staff (28.5, lower than only Boston, NYY, Baltimore, and Cleveland). The pitching age is probably a deceiving figure as the Tigers do have a bevy of young starters.

In the 9th inning, the offense was lead by regulars Ordonez 2-11-397/462/603, Guillen 2-8-299/356/478, and Granderson 2-3-273/355/455. Casey ended his Tiger career with 1-6-424/457/545 in 33 abs. Timo Perez flirted with 400 having 0-7-381/409/500. Righty platoon players Hessman, Rayburn, and Thames went a combined 6-20-302/333/698 on only 63 abs (Interestingly Rayburn and Hessman hit RHP better during the year, although Thames had a huge advantage against LHP). Polanco went 1-4-309/338/412 and Santiago had a similar 0-5-312/333/406. Sheffield> 1-4-234/379/319, Pudge> 0-7-269/278/346, and Inge> 0-6-167/224/222 all limped to the end of personal subpar years. Rabelo, Infante, Cleven, and Maybin went a combined 1-4-163/200/279 in 43 abs.

The Starters were lead by Nate Robertson who was 2-2-3.25era in 4 starts (Nate also had a nice 1st inning as he was 4-3-2.67era-1.15whip in the 1st and 9th innings, and 5-10-5.68-1.62 in innings 2-8). Verlander was 2-1-4.38 giving up 6 HRs including 4 against Cleveland in his 9/18 start. Rogers may have ended his career with 0-2-4.26-1.63. Jurrgens 2-0-5.74-1.34 and Bazardo 1-0-1.84-1.16 may have given us a preview of things to come in 2008.

The bullpen had a very solid 9th inning performance. Lefties Tim Byrdak and Bobby Seay completed very nice seasons by combining for 2-0-0.69-0.92 in 13 innings. Righties Grilli and Miner combined for 0-1-2.25-1.58 in 12 innings. The back end of the bullpen of Zoom-Zoom, Rodney, and Jones combined for 1-1-5sv-2.75-1.07 in 19.2 innings. The rest of the bullpen was 0-0-8.38-1.55 in 9.2 innings.

It should be an interesting off season. The last 2 years have been similar in the fact that the team started strong then hit huge speed bump. In 2006 the Tigers had the best record in baseball at 76-36 on 8/7, but went 11-23 in their next 34 games then finished 8-8 to go 95-67. In 2007, the Tigers had the best record in baseball at 57-36 on 7/19, but went 11-23 in their next 34 games. A 20-15 after that lead to an 88-74 overall finish.

Fish Eye on the Tigers

Dan Fox at Baseball Prospectus recently did a post where he used the enhanced gameday (aka pitch/fx) data to categorize hitters by eye. He broke hitters down into the following groups and subsequently created some pretty slick graphs.

  • Square: This is the new metric, defined as the percentage of pitches in the strike zone swung at and made contact with. A high value here (relative to the average of over 87 percent) indicates that when the batter offers at a strike he usually makes contact. On the contrary, a lower value indicates hitters who, for reasons such as a long swing, are more apt to swing through strikes.
  • Fish: Defined as the percentage of pitches out of the strike zone that the hitter swung at. A higher percentage here indicates that the hitter may have trouble recognizing pitches since he is offering at pitches that would likely be called balls. Average values here are between 32 and 33 percent.
  • Bad Ball: Defined as the percentage of pitches out of the strike zone that were swung at where contact was made. This includes foul balls, although there is an argument to be made that a foul ball is not the intended outcome, and so should be discounted in some way. A higher value in this category indicates that, when swinging at bad pitches, the hitter is at least able to get the bat on the ball. Average values lie around 73 percent.
  • Eye: Defined as the percentage of pitches in the strike zone on non-three and zero counts that were taken for strikes. A smaller value in this metric indicates a player who recognizes strikes and aggressively offers at them. I excluded 3-0 counts, since a hitter is much more likely to let a strike go by in this situation, and we don’t want to penalize them for that behavior. Average values here are in the range of 25 to 27 percent.

While Detroit Tigers hitters were included in the analysis, it was tough to tease out exactly where they fell. Inspired, I thought I do the same analysis but focus on the Tigers. My numbers didn’t work out exactly the same as Fox’s, but the categorization of the players seemed to be fairly consistent. One reason for the disparity on the Eye metric is that the way I parse the data, I didn’t have the count readily available so I didn’t filter out taking on 3-0. The other discrepancy is probably the width of strike zone used. Fox said he used the 17 inch wide plate. Because only a portion of the ball has to cross the plate for a strike, I included the radius of the ball on either side of the plate as well. I’m also not sure how he included bunts and bunt attempts or being hit by a pitch. Regardless, the points remain the same.

As for the specifics on how the numbers differed, here are the league averages I calculated for each:

  • Square: 86%
  • Fish: 29%
  • Bad Ball: 70%
  • Eye: 36%

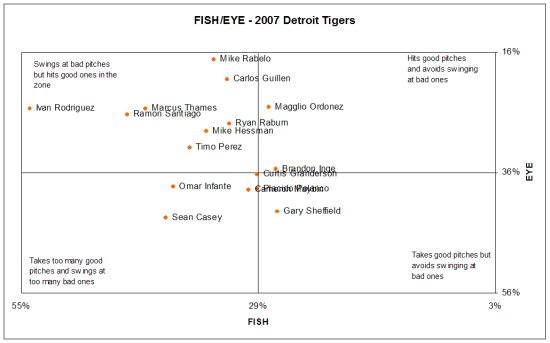
Fox then graphed Fish value against Eye values which put hitters into one of four categories. The graph of just the Tigers hitters is below:

Tigers batting eye

The first things that jump out in these types of graphs are the outliers. I don’t think that anyone is surprised that Pudge Rodriguez swings at more pitches out of the zone than anyone on the team. In fact, he swings at more than anyone in Major League Baseball.

What may surprise though is Sean Casey being in the lower left quadrant. Casey doesn’t strike out a whole lot, but he tends to swing at the bad pitches and take the good ones. The other surprise, especially given his strikeout rates, is Brandon Inge who is better than many of his peers in swinging at the pitches he should swing at and taking the ones he shouldn’t. Of course check swings where you go to far are still counted as swings so make of that what you will.

The last thing to notice is pretty much a team wide trend, and that is that the team tends to lean towards to the left, and that they are more likely than a typical team to chase pitches out of the zone. Even those players in the more patient hemisphere still are towards the middle. On a team level it confirms what pretty much everyone suspected based on observations.

The table below has the numbers for each of the Tigers:

Player			SQUARE	FISH	BADBALL	EYE
Brandon Inge 84% 27% 54% 35%
Cameron Maybin 80% 30% 40% 39%
Carlos Guillen 86% 32% 73% 20%
Curtis Granderson 89% 29% 63% 36%
Gary Sheffield 87% 27% 79% 42%
Ivan Rodriguez 81% 54% 77% 25%
Magglio Ordonez 88% 28% 76% 25%
Marcus Thames 73% 41% 63% 25%
Mike Hessman 82% 35% 65% 29%
Mike Rabelo 83% 34% 74% 17%
Omar Infante 84% 38% 79% 38%
Placido Polanco 96% 29% 89% 39%
Ramon Santiago 86% 43% 73% 26%
Ryan Raburn 77% 32% 60% 28%
Sean Casey 95% 39% 84% 43%
Timo Perez 88% 37% 84% 32%
Team 86% 33% 72% 32%

Baseball Prospectus | Articles | Schrodinger’s Bat: The Return of the Fish Eye

The 8th Inning

Sam Hoff has been breaking down how the Tigers do in each 18 games stretch of the season, as 18 games is 1/9th of the season, or 1 inning. The 8th inning includes games through Monday night.

The 8th Inning is over.

Each 18 games represent 1 inning of a baseball season. The Tigers record so far in each Inning:

                                                        Starters:         Bullpen:
    W-L   RS-RA   HR-SB-AVG/OBA/SLG    W-L-IP-   ERA       W-L-S-ERA
1: 10-8   86 -79  17-9 -235/313/380    5-2-110.2-3.66      5-6-8-4.68 
2: 13-5   112-97  23-10-308/377/518    9-3-102.1-4.84      4-2-8-5.03
3: 7-11   110-96  26-7 -310/364/517    7-7-110.2-3.99      0-4-3-7.80
4: 13-5   136-75  20-5 -324/390/508   13-4-103.0-4.37      0-1-2-3.47
5: 11-7   91 -79  23-20-272/357/443   10-5-112.0-3.46      1-2-7-3.33 
6: 7-11   84 -113 17-8 -276/325/415    3-8- 99.2-6.59      4-3-6-4.31
7: 7-11   83 -110 20-10-266/315/436   4-10-101.0-6.50      3-1-4-5.12
8: 10-8   95 -77  15-18-298/373/455    4-5- 91.1-4.93      6-3-1-3.18

The 8th inning started with a loss to Cleveland, the Tigers then took 3 of 4 from the Yankees, that was followed by losing 5 out of 7 to KC, Oakland, and the White Sox. Winning 5 out of the last 6 including last night’s miracle gives some glimmer of hope. I think the Tigers must get to 92 wins and sweep Cleveland in the remaining 3 game set to have a chance. That would mean going 14-4 in the 9th inning. The Tigers have not had a 14-win inning in 2006 or 2007, though they have had four 13-win innings.

The offense came to life as Granderson, T Perez, and Maggs all batted over 400 with a OPS over 1000 (Granderson and Maggs tied for the lead with 15 RBIs). Polanco, Inge, Pudge and Casey all had good performances. Carlos Guillen was 2-12-235/304/397 as he continues to get RBI even though he is slumping. Thames has played himself onto the bench as he morphed into C-Mo with a 1-7-209/244/349. Ramon Santiago started 8 games and performed as expected (235/297/353). The rest of the team was 127/238/181 in 110 ABs including 0-17 by Sheff.

Verlander is hot as he won all 3 starts with a 0.83 era. Robertson, Rogers, and Durbin combined for 7 starts without a win, but did have a combined 3.38 era in 40 innings. Bonderman was 1-3 in 4 starts with a 7.91 era. Miller, Jurrgens, and Vasquez had 4 starts combined lasting a TOTAL of 10.1 innings in those starts.

The back end of the bullpen (Zumaya, Rodney, and Jones) was 0-2 with 1 save and a 5.40 era in 23.2 innings. The middle relief of Grilli, Miner, Seay (3 wins!!!), and Brydak were a combined 4-0 with a 0.92 era and a 0.67 WHIP in 39 innings. The rest of the pen (Bazardo, Capellen, Durbin, and Vasquez) was 2-1 with a 6.23era in 13 innings.

I read where baseball prospectus gives the Tigers a 15% chance of making the playoffs. I think they may be generous. Unless Cleveland totally collapses (I can’t see a Yankee collapse), we need 14 wins to have a shot. With the rotation in flux and the middle relievers presently carrying the load, 14 wins is a real long shot.

Granderson and the Quad-20

Congratulations to Curtis Granderson becoming one of only 3 players in the history of Major League Baseball to post a season totals of 20 or more doubles, triples, homers, and stolen bases. While the plateaus are kind of arbitrary it is still a remarkable achievement and helps to highlight just how special of a season that Granderson is having. He’s all over the AL leaderboards:

Slugging – 5th
OPS – 9th
Runs -2nd
Total Bases – 3rd
Triples – 1st (with more than double the next closest)
Runs Created – 4th
Extra base hits -2nd

And those ranks were prior to today’s 4 for 4 game. Plus he’s done it while playing a key position expertly in the Major’s biggest centerfield. The guy has to finish in the top 10 in MVP voting or something is seriously wrong.

As for those other seasons they belong to Frank Wiildfire Schulte and Willie Mays. Each of those seasons were pretty interesting as well.

Frank Schulte, 1911

Have you ever taken a look at the 1911 NL leaderboards? If you had you probably knew of Schulte, which not many do. He won the MVP that year as led the league in homers with 21 when the next closest was 16. He led in RBI, total bases, and slugging and tied with Honus Wagner for the lead in adjusted OPS. He stole 21 bases that year, which really wasn’t a big deal for the era, when the leader had 81. But he did so with out being caught once. Interestingly he was second in the league with 31 sacrifice hits. Unlike Granderson Schulte only struck out 76 times. But unlike 2007, that was enough to lead the league.

Willie Mays, 1957

People kind of know about Willie Mays, cuz he’s like really good. In 1957 he was a 26 year old who already had an MVP award under his belt. He finished with 35 homers, the best total of the three,, 20 triples, 26 doubles, and 38 stolen bases. He was caught 19 times though which isn’t all that impressive and it was by far the highest total in his career. He managed to wrack up all those extra base hits despite 15 intentional walks. And he racked up all those homers despite striking out only 62 times. But Willie is just really really good.

Other coverage

Tiger Tales: A Detroit Tigers Blog: Granderson Reaches 20 20 20 20
Roar of the Tigers | MVN – Most Valuable Network » Blog Archive » win or lose, Granderson is The Man (possibly The Tiger)

The 7th Inning

Ed Note: Reader Sam Hoff has been breaking the season down into 18 game “innings” and calculating the results. Here is the report for the 7th inning, which ended with Justin Verlander’s loss. Mike R has joined in the effort and is tracking a multitude of stats.

The 7th Inning is over.

Each 18 games represent 1 inning of a baseball season. The Tigers record so far in each Inning:

                                        Starters:         Bullpen:
    W-L   RS-RA   HR-SB-AVG/OBA/SLG    W-L-IP-   ERA       W-L-S-ERA
1: 10-8   86 -79  17-9 -235/313/380    5-2-110.2-3.66      5-6-8-4.68 
2: 13-5   112-97  23-10-308/377/518    9-3-102.1-4.84      4-2-8-5.03
3: 7-11   110-96  26-7 -310/364/517    7-7-110.2-3.99      0-4-3-7.80
4: 13-5   136-75  20-5 -324/390/508   13-4-103.0-4.37      0-1-2-3.47
5: 11-7   91 -79  23-20-272/357/443   10-5-112.0-3.46      1-2-7-3.33 
6: 7-11   84 -113 17-8 -276/325/415    3-8- 99.2-6.59      4-3-6-4.31
7: 7-11   83 -110 20-10-266/315/436   4-10-101.0-6.50      3-1-4-5.12

The 7th inning was almost identical to the 6th. The Tigers will start the 8th inning by trying to get within ½ game of Cleveland and win a series for the 1st time in 5 weeks. The only reason the Tigers have hope is because Cleveland is also playing poorly (11-16 in their last 27).

The offense is still being lead by Mags 8-22-352/403/718 and Polanco who was 2-4-317/396/512 in only 11 games thanks to the flu. Guillen, Rayburn, and Thames were passable with a combined 6-23-279/304/491 in 165 abs. Maybin, Infante, and Santiago produced 1-4-400/455/633 in only 30abs (Infante was 7 for his last 14 when he was sent down?). The catching duo refuses to walk and were a combined 1-4-264/274/389. Casey 1-7-255/293/345, Granderson 0-3-203/311/297, Sheff 1-4-196/268/294, and Inge 0-8-208/232/302 represent 44% of the lineup that are not doing anything.

The starters continue to get bombed. Jurrgens was 1-1-3.29 providing a big boost out of AA ball. Durbin 0-3-7.71, Bonderman 0-3-6.23, Verlander 2-1-6.75, and Robertson 1-1-5.59 all were inept. Tata got Bombed his only start.

In back end of the bullpen appears to be hitting on all cylinders as Jones, Rodney, and Zumaya were 1-0-4-1.35 in 13.1 innings. Seay and Bazardo combined for 0-0-2.00 in 9.0 innings. The rest of the bullpen was 2-1-0-6.32 giving up 51 hits and 21 walks in only 35.2 innings.

This most recent inning was almost identical to the 6th inning performance. The team has now had 3 losing innings amongst the 7. In 2006, the team only had 1 losing inning. If this team is to make the postseason, both of the next 2 innings must be winning efforts.

Mike R also compiled a comprehensive spreadsheet detailing the inning with a plethora of stats including BABIP, FIP, and many more for each player.

The 6th Inning

Sam continues his look at each 18 game stretch of the season…

The 6th Inning is over.

Each 18 games represent 1 inning of a baseball season. The Tigers record so far in each Inning:

                                                Starters:         Bullpen:

   W-L   RS-RA   HR-SB-AVG/OBA/SLG    W-L-IP-   ERA       W-L-S-ERA

1: 10-8   86 -79  17-9 -235/313/380    5-2-110.2-3.66      5-6-8-4.68 

2: 13-5   112-97  23-10-308/377/518    9-3-102.1-4.84      4-2-8-5.03

3: 7-11   110-96  26-7 -310/364/517    7-7-110.2-3.99      0-4-3-7.80

4: 13-5   136-75  20-5 -324/390/508   13-4-103.0-4.37      0-1-2-3.47

5: 11-7   91 -79  23-20-272/357/443   10-5-112.0-3.46      1-2-7-3.33 

6: 7-11   84 -113 17-8 -276/325/415    3-8- 99.2-6.59      4-3-6-4.31 

Wow the 6th inning was ugly! They started with a sweep in Minnesota and then lost 4 straight series since (3 to losing teams). Unlike the 3rd inning when we had an identical record but were killed by a shaky bullpen, they were outplayed in every facet of the game. The Tigers are a mere 84-78 over their last 162 regular season games.

The offense had great contributions from some unexpected places as Rabelo and Rayburn combined for 3-10-410/421/732 in 56 ABs. Granderson 3-8-328/394/547, Ordonez 2-16-324/387/471 and Polanco 2-8-382/408/559 all continue to swing well. Sheff 1-5-175/273/263 is hurt and you figure he may hit the DL at some point. Guillen 0-2-283/317/350 appears to be hurt as he is hitting with no power. The trilogy of Monroe 2-9-240/250/380, Inge 1-6-238/269/349 and Casey 0-4-245/298/283 combined to have a 241/280/337!! Pudge continues to run hot and cold as he was awful 1-4-184/180/265.

I am not sure what has happened to the starting pitching, but they have all collectively seemed to hit a wall. They are averaging 5.5 innings per start and actually had an ERA of 7.08 without the single starts Vasquez and Tata who were 1-0-3.00. Verlander 0-1-5.00, Robertson 1-3-5.47 and Miller 1-1-6.75 were mediocre while Rogers 0-1-10.45 and Bonderman 0-2-10.12 were horrible. Rogers has an excuse in his elbow. I am not sure of Bonderman’s issue, he did have 14 strikeouts in 16 innings?

In the bullpen Capellan and Durbin struggled as they had identical 6.75 eras in 13.1 combined innings. The lefty trio of McBride, Seay, and Byrdak had a respectable 3.86 era but gave up 30 base runners in 16.1 innings. Miner and Grilli were pretty good as they scarped up 3 wins and had a 3.38 era. Jones had 5 saves and a 3.38 era giving up 7 base runners in 8 innings.

This most recent inning was the worst performance since the 5-13 8th inning in 2006. A couple of key guys are dealing with injuries on offense and the starting pitching has hit a wall. A good trade deadline move will often pick up a team emotionally (like Texeria for Atlanta). The Tigers set silently and now must find a way to get their ship righted or they will be watching the playoffs on TV this year.

The 5th Inning

Sam has been running reports on how the Tigers do over each 18 game period (or inning). He’s been kind enough to let me post games 73-90, aka the 5th inning:

The 5rh Inning is over.

Each 18 games represent 1 inning of a baseball season. The Tigers record so far in each Inning:

                                       Starters:               Bullpen:
    W-L   RS-RA   HR-SB-AVG/OBA/SLG    W-L-IP-   ERA       W-L-S-ERA
1: 10-8   86 -79  17-9 -235/313/380    5-2-110.2-3.66      5-6-8-4.68 
2: 13-5   112-97  23-10-308/377/518    9-3-102.1-4.84      4-2-8-5.03
3: 7-11   110-96  26-7 -310/364/517    7-7-110.2-3.99      0-4-3-7.80
4: 13-5   136-75  20-5 -324/390/508   13-4-103.0-4.37      0-1-2-3.47
5: 11-7   91 -79  23-20-272/357/443   10-5-112.0-3.46      1-2-7-3.33 

The offense has finally tapered off and averaged only 5 runs/game. For the 1st time since the first inning they batted under 300 and slugged under 500. The 357 OBP was pretty good for a 272 BA.

Sheff continues to rake with 5-13-390/500/695 with 9 (yes NINE) SBs. Sean Casey is finally performing like the Tigers thought he would with 1-9-380/458/560 (6 2Bs). Thames is making the most of his opportunity with 5-13-289/312/689. On the flip side Magglio has come back to earth 1-7-254/342/317. Inge’s toe has heeled, but he is back to his old ways but without power 0-5-211/297/263. Infante was 3-28 with his 1st HR. Monroe was 0-4-119/174/143 in 42 ABs.

Both the Bullpen and the Starters had their best performance, 16 unearned runs and 21 errors indicated a team wide fielding slump. The best starter statistically was Bonderman 2-1-2.10era-30k/30innings. Verlander was 3-1 but had a 4.50 era. What was weird is the fact that he gave up only 22 hits, 8 walks, and 3 HRs in 26 innings (with 29Ks). Miller was 2-2-3.13era (18k/23inn). Robertson was 1-0-4.32era. Rogers was 2-1-3.86era. The bullpen’s ERA was 1.90 without the 11.1 innings thrown by Byrdak, De La Cruz and Grilli. Chad Durbin threw 11.1 innings (2.38era). Miner and Seay were perfect for 10.1 combined innings. The new guys, Capellan and McBride combined for a 2.31era in 11.2 innings. Jones had 6 saves with a 3.12era.

11-7 and a better performance by the pitching staff was an encouraging sign. The next 17 games come in 16 days with only 3 coming at home. It will be a tough stretch, but the Tigers have proven to be a very good road team.

-Sam Hoff

Tigers Run Distributions

One of my favorite exercises is to examine run distributions. With the All Star Break it gives me a chance to look at where the Tigers rank in terms of runs scored and runs allowed by game.

First up we’ll take a look at the offense and runs scored per game.
07rs.JPG
To explain the graph, the column height represents the total number of games in which the team scored x amount of runs. The orange represents the number of games the team won and the blue is the number lost. The yellow line shows the cumulative percentage of games played at that run level.

This pretty much reiterates what we already know. The team is rarely shut down completely, and frequently puts a pounding on teams by scoring more than 5 runs in 59% of their games. MLB as a whole has only topped 5 runs in 46% of games.

But what you’ll also notice is that the Tigers need all those runs. Even when scratching out 3 runs, the team only won 4 o f 14 games.

For some context here is the same chart for all of MLB in 2007:
mlb07.JPG

The flip side of course is runs allowed. Here is the Tigers distribution:
07ra.JPG

Now the other thing we can do with this is look at the distribution, compare it to the winning percentage at various run levels for MLB, and come up with expected win totals.

Working with the run scored distribution and multiplying by the expected winning percentage we see that the Tigers expected record given a normal runs allowed distribution would be 50.1-35.9. That’s pretty close to their actual 52-34 record.

Now of course the Tigers runs allowed distribution isn’t representative of MLB. Performing the same exercise with runs allowed, one would expect the Tigers to have a 42.6-43.4 record given normal run support. So essentially without the strength of their offense they’d be a .500 team. This is hardly earth shattering news in that the bats have clearly been the strength of this team. But it does help to highlight the magnitude that the different components have contributed to the resulting record.

The other thing to note is that on both counts the Tigers record is shy of their actual record. So one could conclude that the team has been a little lucky given the way that things have shaken out. I want to emphasize the little part of luck. If you look at their pythagorean record, they are right on pace with their actual. So this isn’t to say they are doomed or aren’t a good team. I also wouldn’t call this predictive, but simply a record of what has happened so far.

Comerica Hitters Park

The Tigers offense has been getting all kinds of well deserved pub. They’re averaging 6 runs a game. Little did we know that their pitcher’s paradise has played as a hitters haven so far in 2007.

Ever since Comerica Park opened in 2000 it has been cited as a pitcher’s park. While it did suppress run scoring a little, it’s always been possible for offenses to generate a decent batting average. Still, that spacious centerfield and deep left field have always suppressed homers. And when the left field fence was brought in it helped to even things out for the sluggers, but still it played to the pitcher’s advantage. Until this year.

Park Factors help to provide context to offensive events by comparing the offensive events in a home stadium to those on the road. I calculated the 2007 factors using the method described in the Bill James Handbook. In the case of homers, you add all the homers hit by the Tigers and their opponents in Comerica Park and dividing by the number of at-bats between the 2 teams. That number is then divided by the same calculation for when the Tigers are on the road and playing in their opponents parks and the result is multiplied by 100. A value of 110 would mean that it is 10% easier to achieve the feat at home, where a figure below 100 means that the park suppresses the event.

The table below shows the Comerica Park park factor for 2007, as well as the 2004-2006 seasons. The previous seasons were taken from the Bill James Handbook.

		2007	04-06
Runs		110	 95
Hits		101	102
Doubles		102	 86
Triples		114	155
Homers		117	 86

A couple things to note:

  • Comerica is widely regarded as a great doubles park, and that is largely unfounded. Even this year it is barely above neutral.
  • With batting average remaining pretty consistent, the increase in Comerica scoring has to be attributed to the increase in homers, and to a lesser extent doubles.
  • Triples are down, but they are a rare enough occurrence and it is early enough in the season that 2 or 3 triples could really swing this. I have full confidence that Comerica Park and Triplesville will still produce plenty of 3 baggers.
  • Related to triples, Curtis Granderson has single handedly impacted this metric with 10 of his 12 triples coming on the road.

I don’t mean to diminish the quality of the offense by attributing it to Comerica Park. The team is still hitting 289/349/472 on the road so the offense is just flat out good. We’re still barely more than a third of the way through the season, so it remains to be seen how this will play out. But for a park that has always played big in the past, it sure is playing small now.

Stuff that doesn’t fit elsewhere

You may have noticed I’ve been doing a little something different with link posts. I’ve been posting things to del.icio.us throughout the day, and then del.icio.us will dump them all into a blog post. It’s nice and convenient for me, but I don’t have as much room to comment. So tonight I’ll go old school.

Schedule Changes

The Tigers have had a couple start times change, and had a couple of their rainout make ups added. The May 26th game against Cleveland and the June 23rd game against the Braves have been moved from 7:00pm to 3:55pm and are now part of the Fox National package. The June 16th game originally scheduled for 3:55 on Fox was moved to 7:00pm and will be on FSN Plus.

The Toronto rain out/cold out will be made up on September 10th at 7:00pm and will be televised on FSN Detroit.

The White Sox rain out will be made up as part of a day-night doubleheader with a 2:00pm first pitch on July 24th. It’s in the middle of a string of 16 consecutive games without and off day, so an additional starter will need to be called up.

Bondo ready to return

Danny Knobler reports that Jeremy Bonderman looks likely to return to the rotation on Friday night. The Tigers are already doing enough mixing and matching with their arms, so getting things back to normal will be nice.

Infante to change at-bat music

From the same Knobler piece, we find out Placido Polanco’s and Omar Infante’s at-bat music. I’ve long said that my favorite at-bat music for any Tiger is Infante’s so finding out artist (Tono Rosario) was great. But finding out that Infante planned to change it was disappointing to say the least.

Granderson doesn’t need no stinkin’ batting average

Beyond the Boxscore has been handing out weekly awards and last week Curtis Granderson won the Batting Average is For Wussies award on the strength of a 975 OPS despite a meager 250 batting average. That’s been par for the season for Granderson. Curtis is 7th in slugging and tied for 2nd in extra base hits. What’s new is that he’s started to walk. After only 6 walks in April, he’s already at 7 in May.

Times 5

Wednesday night the Tigers played their 32nd game of the season. That game is significant in that it basically represents one-fifth of the season. While it is a substantial number of games, you can still get some funny results playing the “on pace for game.”

The Offense

Using the Baseball Musings day by day database, it’s easy to get the performance over a given time period. The Tigers offensive performances over the first 32 games can be found here.

Below is a spreadsheet with all the counting stats multiplied by 5: Continue reading Times 5