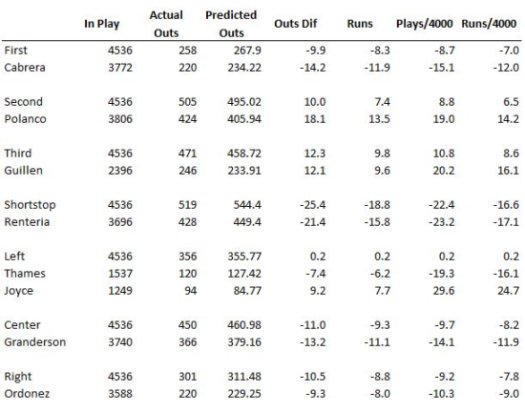
The Tigers defense was the cause of much consternation this season, and rightly so. Now that David Pinto has released his PMR defensive metrics, we can take a detailed look at each position.
If you’re not familiar with PMR, it is a system that looks at each ball hit into play and the probability that the ball should be converted into an out. That probability is based on a number of characteristics including the handedness of the batter and pitcher, the type of hit, the direction of hit, and how hard the ball was hit. It is based on data from BIS which also provides the data behind the +/- system and revised zone rating.
The table below shows how the Tigers fared at each position, as well as the primary players at each position. It shows the number of balls in play (this is constant at the team level), the actual outs and predicted outs, the plays made above or below expected and then a conversion to runs. The last 2 columns scale the plays and runs to 4000 balls in play which is approximately 150 games or the normal workload of a full time player.

Continue reading The Tigers according to PMR